Built on 8 official US data sources

The US housing market,
on a deeper level.

Drill from a national headline to a single ZIP. Compare regions side by side, track 130+ metrics over time, and trace every value back to its public US source — all on one interactive map.

propsight.app/map
Propsight map showing a national choropleth of US median sale prices with a region detail drawer open.
Common use cases

How people use Propsight.

Same dataset, four common workflows. Pick the one closest to yours.

For buyers

Research a neighborhood before you make an offer.

  • See median sale price, days on market, and inventory at the ZIP level — not just the metro average.
  • Compare neighborhoods side by side on the same chart.
  • Pull up six or twelve months of history to put the current numbers in context.
Open the map
Region detail drawer showing every metric tracked for a selected county.
For sellers

Understand pricing dynamics in your area.

  • View sale-to-list ratios for your county and ZIP, refreshed as new closings drop.
  • Track how days on market is trending in your neighborhood.
  • Switch any metric to a year-over-year or month-over-month view.
Check your market
For agents

Show clients sourced data, side by side, in one tab.

  • Open the region drawer to see every tracked metric for a single ZIP, with source attribution.
  • Plot up to ten farm metros on the same chart.
  • Use time-travel to compare current numbers against any prior month back to 2018.
Explore the charting tool
Charting view comparing home values across ten metros over time.
For investors

Filter every US market against your criteria.

  • Stack multiple criteria — price under, yield above, inventory falling, employment growing — and see every place that qualifies.
  • Sort the results by any metric and drill into any ZIP without losing your filter.
  • Review three years of monthly history for any place that matches.
Open the screener
Screener listing every metro that matches a multi-metric filter, sortable by any column.
How it works

Three tools, one dataset.

Move between them without losing your place. Same metrics, same geographies, three views of the same data.

01

The map

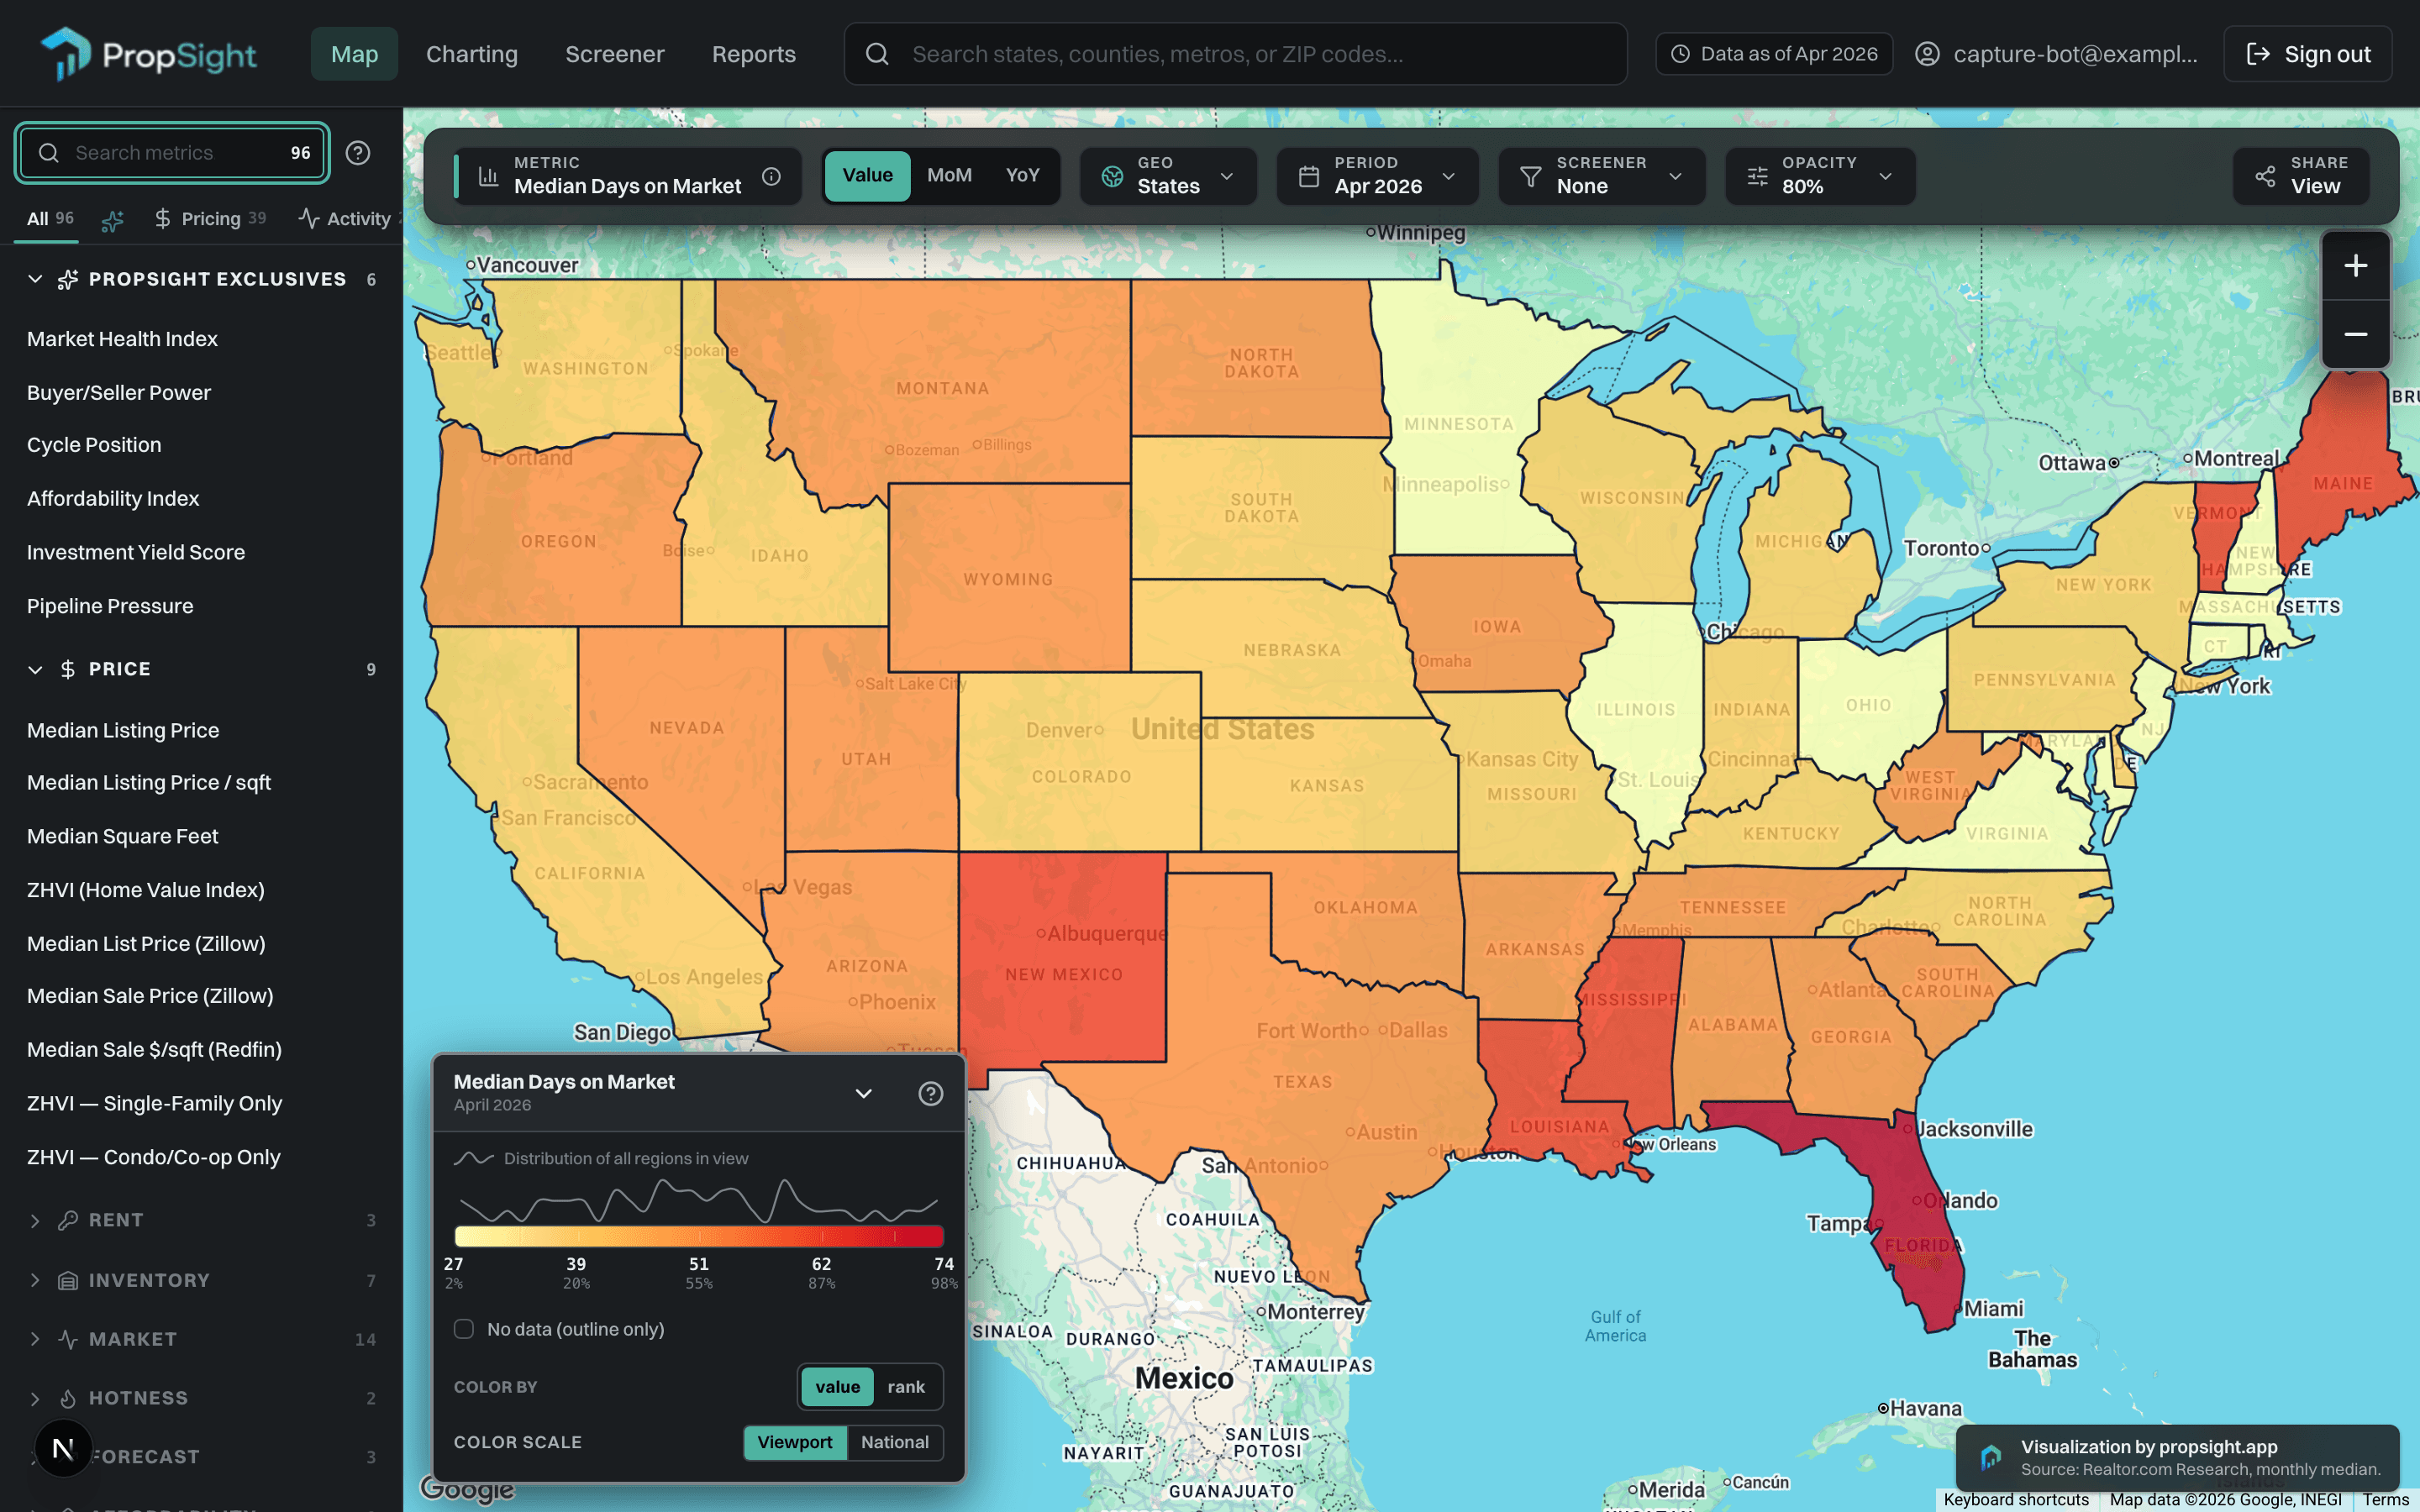
Pick a metric. The map renders the whole country at once, with smooth transitions across four geographic levels: state, metro, county, and ZIP.

02
The Screener tab listing every metro that matches a multi-metric filter.

The screener

Stack as many criteria as you want — price under, yield above, inventory falling. The screener returns every place that meets them, sortable by any column.

03
A scatter plot of every US metro on Median Listing Price vs Median Days on Market.

The chart

Plot up to ten metros, counties, or ZIPs as a time-series — or flip to cross-section to scatter every market against two metrics at once. Toggle MoM, YoY, or indexed views, with history back to 2018.

Data sources

Nine sources. Years of history. Always current.

Propsight pulls from nine public US datasets — federal agencies plus a handful of industry providers. Most metrics carry monthly history back to 2018; some series go back decades. Each one refreshes automatically as the source publishes new data.

  • Zillow Research
    Zillow Research
  • Census ACS
    US Census Bureau · American Community Survey
  • FRED
    Federal Reserve Economic Data
  • BLS LAUS
    Bureau of Labor Statistics · Local Area Unemployment
  • Census BPS
    US Census Bureau · Building Permits Survey
  • HMDA
    Home Mortgage Disclosure Act
  • IRS SOI
    IRS Statistics of Income · Migration
  • NMDB
    National Mortgage Database
  • CFPB MPT
    CFPB Mortgage Performance Trends
Free with an account

Pick a metric. See the country.

All features are available after creating a free account. No credit card, no paid tier, no usage caps — just an email so we can save your views and send a note when major data drops.